Contents
ONE-MINUTE BRIEF
Four conclusions to start with
- First identify where the benefit comes from. Fuel saved, a payment from a customer, and lower supply risk are different sources of value, and each needs its own evidence.
- Improvements on ships in service need comparable operating data. The equipment effect, the conditions of use and the new costs together decide the net benefit.
- Alternative fuels have to be costed through to use on board. Beyond the price at the point of production, logistics, storage, bunkering, equipment efficiency and the ship’s arrangement all matter.
- A long-term investment needs a credible demand commitment. Aggregated procurement, offtake and the design of finance can improve a project’s conditions. Their results still have to be shown by the contract and by actual delivery.
Identify the costs and revenues behind the expected benefits
COSTS, REVENUE & VALUE
A measure can reduce emissions without automatically lowering the shipowner’s total cost. An assessment starts by fixing the basis of comparison, then identifying each item of expenditure and benefit.
Three levels are a useful way to sort them:
| Source of benefit | Question to answer | Evidence needed before it enters the assessment |
|---|---|---|
| Source of benefitOperating cash benefit | Question to answerHow much fuel or other expenditure falls? What new maintenance, consumables and energy costs arise? | Evidence needed before it enters the assessmentComparable operating data, quotations and a maintenance plan |
| Source of benefitCommercial and contract benefit | Question to answerIs a customer willing to pay for a lower-emission service? How is that revenue shared? | Evidence needed before it enters the assessmentThe contract, payment terms and how the service is verified |
| Source of benefitRisk and availability value | Question to answerDoes it improve fuel availability, continuity of operation, or room to adjust later? | Evidence needed before it enters the assessmentSupply arrangements, scenario analysis and a concrete response |
The third type of value can be significant without necessarily translating into an annual cash benefit. A green premium that is not yet contracted, a subsidy that is not yet certain, or a cost reduction that is not yet demonstrated belongs in a conditional case. It should not be mixed into the base-case benefit.
Another necessary question is: is the party that pays also the party that receives the fuel-saving benefit? If the fuel bill, the equipment investment and the operating decision sit with different parties, the assessment has to include the charter and how the benefit is shared. Only then can anyone judge whether each party has a reason to take part.
Improvements on ships in service start by testing the conditions under which they work
IN-SERVICE FLEET
Page 19 of the annual report records five in-service workstreams taken forward by the Maritime Emissions Reduction Centre (MERC): onboard carbon capture, biofuel deployment, readiness for wind-assisted propulsion, variable-frequency-drive optimisation, and data standardisation.
These workstreams create economic value through different mechanisms. An efficiency improvement may reduce energy use. A fuel switch or carbon capture has to be assessed against its emissions goal, its supply and its operating cost, and should not be treated as the same kind of fuel-saving measure. Data standardisation is what makes results from different ships and different periods more credible to compare.
The report says that three of the workstreams are under way, and that the biofuel and data-standardisation workstreams have been defined. It does not publish a fuel-saving rate, an installation cost or a payback period that can be applied to every ship. The set of workstreams is useful for seeing what to assess. It is not a guarantee of the benefit from buying a piece of equipment.
For a single ship, a before-and-after difference in fuel consumption has to be read together with speed, draught, loading condition, sea state and operating pattern. If operating conditions changed during the comparison period, the observed difference cannot be attributed entirely to the new equipment. That comparison principle helps when reading a result. The MERC progress described above does not itself provide a ship-specific test result that can be applied directly.
An illustrative example: how the fuel-saving rate changes payback
ILLUSTRATIVE CALCULATION
The figures below illustrate the calculation method only. All figures are hypothetical and do not represent market quotations or measured results from any particular vessel or MERC project.
Assume an energy-saving measure on the following terms:
| Item | Assumed value |
|---|---|
| ItemInitial outlay, including equipment, installation and estimated losses from downtime | Assumed valueUSD 300,000 |
| ItemAnnual baseline fuel, for the same transport work and operating conditions | Assumed value5,000 tonnes |
| ItemFuel price used in the assessment | Assumed valueUSD 600 per tonne |
| ItemAnnual fuel-saving rate | Assumed value3% |
| ItemExtra maintenance and operating cost each year | Assumed valueUSD 10,000 |
If those conditions hold every year, and the investor receives the whole of the fuel saving:
- Fuel saved per year: 5,000 × 3% = 150 tonnes.
- Fuel-cost saving per year: 150 × 600 = USD 90,000.
- Net cash saving per year: 90,000 − 10,000 = USD 80,000.
- Simple payback: 300,000 ÷ 80,000 = 3.75 years.
That annual net cash saving does not yet allow for finance or tax, and it does not include subsidies, carbon-related charges or extra income. Simple payback does not reflect discounting, residual value, or benefits after the outlay has been recovered.
If only the actual fuel-saving rate changes, and the other assumptions stay the same, the result changes sharply:
| Assumed annual saving rate | Fuel saved per year | Net cash saving per year | Simple payback |
|---|---|---|---|
| Assumed annual saving rate1% | Fuel saved per year50 tonnes | Net cash saving per yearUSD 20,000 | Simple payback15 years |
| Assumed annual saving rate3% | Fuel saved per year150 tonnes | Net cash saving per yearUSD 80,000 | Simple payback3.75 years |
| Assumed annual saving rate5% | Fuel saved per year250 tonnes | Net cash saving per yearUSD 140,000 | Simple paybackAbout 2.14 years |
The example shows that how reliable the fuel saving is will directly affect the commercial judgement. A formal assessment also has to bring in fuel-price changes, actual hours of use, the ship’s remaining service life, and cash flow that differs from year to year. If savings occur only under certain operating conditions, estimate annual fuel savings from baseline fuel consumption and the achievable saving rate in each relevant condition. Where fuel consumption rates differ substantially between conditions, the share of operating time alone is not a reliable basis for that estimate.
The cost of an alternative fuel runs from the point of production to the ship
FUEL SUPPLY CHAIN
Whether an alternative fuel is economic also depends on whether the supply chain actually joins up.
Page 15 of the annual report notes that 19 bunker ports account for about half of global bunker volume, while about 82% of the candidate alternative-fuel production potential sits outside today’s bunker hubs. Early deployment therefore has to watch the link between production and demand: how the fuel is carried, where it is stored, how it is bunkered, and whether that fits the ship’s route.
The 82% is candidate production potential screened by the research. It is not fuel supply already in production, and it is not a forecast of a future market share. The original report is explicit that findings of this kind are screening assumptions, used to rank options and to guide further research.
For a shipowner, the practical point is to widen the cost comparison to delivery and use. Fuels should not be compared on the price per tonne alone. Heating value, conversion efficiency, transport and storage cost, bunkering conditions, and the effect of the fuel system on the ship’s space and carrying capacity all belong in one consistent basis of assessment.
Official supply-chain research also takes existing bunker demand, candidate production and distribution ports, and the link between supply and demand as its main line of analysis. Those data can be used to choose which supply options are worth checking in more depth. Fuel supply-chain research, 2026-05-26
Turn a willingness to decarbonise into a service that can be bought
DEMAND & PROCUREMENT
Early green-fuel projects face a mutual dependence. Suppliers need credible demand before they invest, and buyers need to see supply and a service that can actually be delivered. Demand aggregation gathers commitments from several buyers into a market signal with more weight.
The Zero Emission Maritime Buyers Alliance (ZEMBA) is a concrete case. In December 2025, ZEMBA announced Hapag-Lloyd and North Sea Container Line as the winners of its second tender. The carriers plan to use e-methanol and e-ammonia, respectively. On the commitments at the time of the announcement, deployment is expected to start in 2027, run for three years, and be extended to five years for some members, with an expected aggregate reduction of at least about 120,000 tonnes of greenhouse gas. That is a combined expectation for a future deployment. It is not an annual reduction already achieved. ZEMBA award announcement, 2025-12-17
The second-round procurement required e-fuels used for main propulsion to achieve at least a 90% lifecycle greenhouse-gas reduction relative to low-sulphur fuel oil, with transparent and independent verification. That 90% is the lifecycle emissions threshold of this procurement. How far methanol or ammonia reduces emissions still depends on conditions such as the production pathway, and it is not the same thing as the proportion of the fuel bill that is saved. ZEMBA second-round procurement
ZEMBA also uses a Book and Claim approach, so the physical flow of cargo and the verified emissions-reduction attribute can be arranged separately. A participating buyer’s cargo is therefore not necessarily carried on the ship that uses the fuel. Emissions-reduction claims must comply with certification requirements, rules for allocating environmental attributes, and the applicable greenhouse gas accounting framework. Buying the environmental attribute does not, by itself, tell you how the cargo was physically carried. As checked on 24 October 2026, ZEMBA’s official material still described contracting for the second tender as ongoing. ZEMBA FAQ
The implication for the economics is this: a green premium is more likely to support a financeable income arrangement when it has a clear payer, a way to verify it, and a party responsible for delivery. A demand commitment can improve the commercial conditions. It does not guarantee that green fuels will immediately become cheaper than conventional fuels.
How financing tools can improve the conditions for investment
FINANCE & BANKABILITY
Pages 17–18 of the annual report treat demand, finance and risk-sharing as related work. Research by the Decarb Hub and the Environmental Defense Fund puts forward three concepts for further piloting:
| Concept | Problem it is meant to address | A practical reading |
|---|---|---|
| ConceptMaritime Multiplier | Problem it is meant to addressThe emissions effect of a shipping investment is hard to show across a supply chain | A practical readingImprove how cross-supply-chain emissions benefits are measured and disclosed |
| ConceptEnergy-efficiency lending platform | Problem it is meant to addressThe size of individual retrofit projects, and the cost of assessing them, affect access to finance | A practical readingAggregate projects and standardise the process, so finance is easier to reach |
| ConceptTime Stacked Offtake | Problem it is meant to addressA buyer’s offtake term is hard to match with the revenue a fuel developer needs | A practical readingExplore demand and risk allocation through shorter offtake arrangements that can follow one another |
The official research still calls for these concepts to be tested in pilots. These concepts do not amount to readily available low-interest loans, guaranteed returns or mechanisms that automatically generate tradable emissions credits. Finance research, 2025-09-08
The report also discusses blended finance, in which different types of capital are structured to bear different levels of risk, with the aim of attracting commercial investment. What it improves is the allocation of capital and risk. Extra cost and risk are still borne by the parties according to the arrangement. The report, which covers July 2025 to June 2026, states that the Port Decarbonisation Blended Finance Facility being developed by the Catalytic Finance Foundation was still at a pre-launch stage during that period. This records progress within the reporting period; subsequent announcements are needed to assess its current funding and investment outcomes.
In the same way, Silk Alliance’s Routes2FID is a framework for helping a project find a path to a final investment decision (FID). Completing a case test, taking an investment decision, and starting operation are different stages of maturity, and progress should be read at each stage separately. (Annual report, pp. 15 and 17–18.)
Turn an economic assessment into a decision that can be tracked
DECISION FRAMEWORK
A business case that can actually be used has to state the baseline, the assumptions, who bears the cost, and how the effect will be confirmed. The flow below is an assessment suggestion drawn from this article.
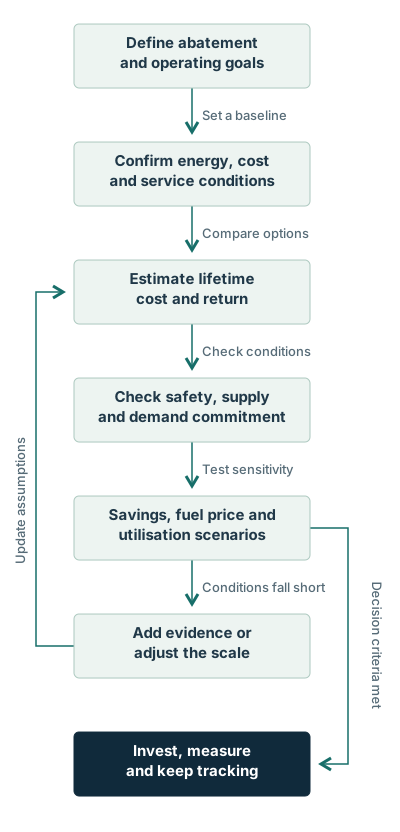
In practice, six questions test whether the assessment is complete:
- What is the effect based on? A supplier’s estimate, a model, a trial, or comparable data from a ship in service?
- What costs does the assessment include? Have equipment, engineering, losses from downtime, training, maintenance and additional energy use all been accounted for?
- Who receives the benefit? Do the fuel saving, any service premium and other income have a clear owner and clear conditions?
- Can the supply be delivered? Are the port, quantity, quality and date covered by a credible arrangement?
- Can the project withstand adverse scenarios? If the effect is smaller, the price changes, or utilisation falls, do the decision conditions still hold?
- How will performance be verified after implementation? Have the measurement, the data quality and the follow-up been agreed first?
Costs or benefits that depend on policy should be calculated separately for the actual route, year and applicable rules. As of 23 October 2026, the IMO lists the resumed extraordinary session on the Net-Zero Framework for 4 December 2026, still subject to confirmation by MEPC 85. A future regulatory cost that has not been settled should not be treated as an expense already in force. IMO MEPC 84 summary
Questions
QUESTIONS & ANSWERS
Does adopting a lower-carbon fuel necessarily lower the total cost?
The cost result depends on the fuel, the equipment, the logistics, the operation and the contract. Some options are valuable mainly because they reduce emissions or meet a customer’s demand, not because they cut the fuel bill directly. The source of value and the payment arrangement both have to be stated clearly.
Is simple payback enough to decide an investment?
It is a quick way to see how the initial outlay relates to the annual cash saving. A full assessment should also look at cash flow over the whole period, discounting, remaining service life and a worse case, and should confirm which benefits the investor can actually receive.
Does joint procurement necessarily make green fuels cheaper?
Buying together can create a demand commitment and a competitive process, and can support supply and price discovery. Whether there is a cost advantage in the end still depends on the terms that are struck, on delivery, and on the basis of comparison. It cannot be inferred from the scale of participation alone.
A practical note: make the benefit something that can be verified
PRACTICAL PERSPECTIVE
A shipowner can start by turning each decarbonisation measure into a set of assumptions that can be tracked: under what operating conditions, at what cost, with what expected effect, and confirmed by whom. Measures with more complete data and more controllable conditions are easier to turn into a business case that can be tested. Projects that involve a new fuel and new infrastructure need commitments at both the supply end and the demand end.
Safety readiness is part of the cost and availability assessment too. Bringing design, training and emergency-response needs in early is what makes it possible to estimate the resources the project actually requires, and to build the economic benefit on an arrangement that can be operated.
Sources and scope
SOURCES & SCOPE
- Lloyd’s Register Maritime Decarbonisation Hub, Impact Report: Year Six, covering July 2025 to June 2026; relevant material on pp. 14–19 and 23. The report does not provide the costs, fuel-saving rates or payback periods used in the example in this article.
- The Decarb Hub, Building the sustainable maritime fuel supply chain, 2026-05-26; on the link between fuel supply and demand, and on what the research is for. The figures for 19 ports and 82% are on p. 15 of the annual report and come from a screening analysis.
- ZEMBA, second-round award announcement, 2025-12-17; the expected years of deployment and the reduction volume follow the commitments at the time of the announcement.
- ZEMBA, RFP 2 and the FAQ, information current to 2026-10-24; on the procurement conditions, the progress of contracting, and Book and Claim.
- The Decarb Hub / EDF, Navigating the Net-Zero Transition, 2025-09-08; puts forward three financing concepts and states that they still need to be tested in pilots.
- IMO, MEPC 84 summary, meeting of 2026-04-27 to 05-01; records the arrangement for a future resumed session and the condition on which it is confirmed.
The cost categories, the assessment flow and the worked example in this article are an interpretation and a demonstration of method. A real project still has to use its own data, contracts, quotations and applicable requirements.